

The Border Record: What Each Party Can Claim—and What It Cannot
Twenty-six years of monthly data show no party owns a straight-line success. The latest decline began under Biden, accelerated under Trump and shows both the power—and the fragility—of executive action.
Immigration politics rewards simple attribution. The operating record does not.
The same border measure has risen and fallen under both parties. Congress has reorganized the agencies, funded barriers and repeatedly debated broader reform. Presidents have changed asylum rules, detention practices, parole programs and the consequences imposed after an unlawful crossing. Mexico has changed its enforcement. Economic conditions and migration crises outside the United States have changed who arrives.
The result is not one continuous Republican or Democratic record. It is a series of distinct operating periods—and the first obligation is to name the measure correctly.
01 · The long record
Neither party has a straight-line record
Between January 2000 and August 2026, recorded Border Patrol activity moved through several cycles rather than one partisan trend. The monthly average for 2000–2019 was about 59,900. The 2021–2024 average was roughly 153,800—2.6 times as high.
The late Clinton-era peak gave way to a long decline across the Bush and Obama years. One of the lowest modern fiscal-year totals arrived in 2017, a year split between the Obama and Trump administrations. The number then rose sharply in 2019 under Trump, before the much larger 2021–2024 surge under Biden.
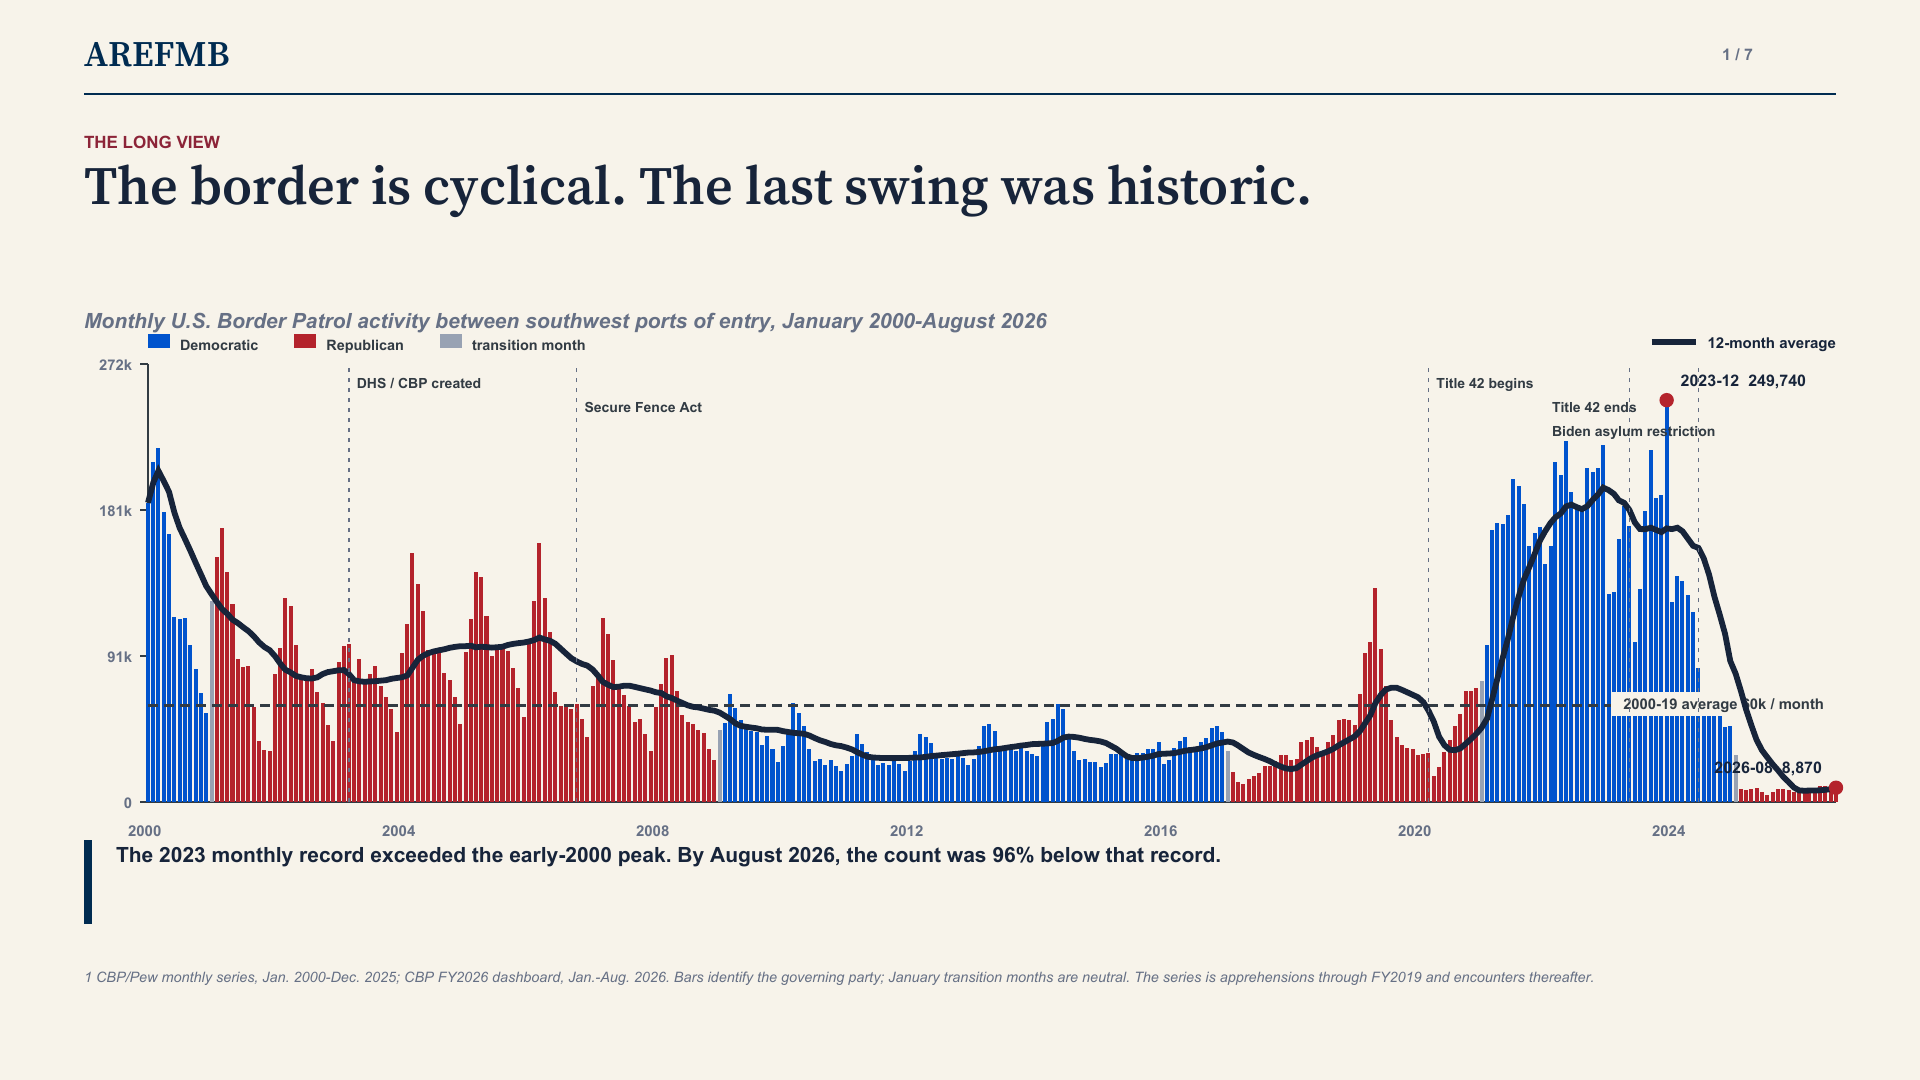
The underlying measure is Border Patrol enforcement activity between southwest ports of entry. It is not a count of successful illegal entries or unique people.
The annual view reinforces the point. High averages show sustained system pressure; high monthly peaks show how quickly that pressure can overwhelm processing capacity. Both matter. Neither is explained by the president’s party alone.
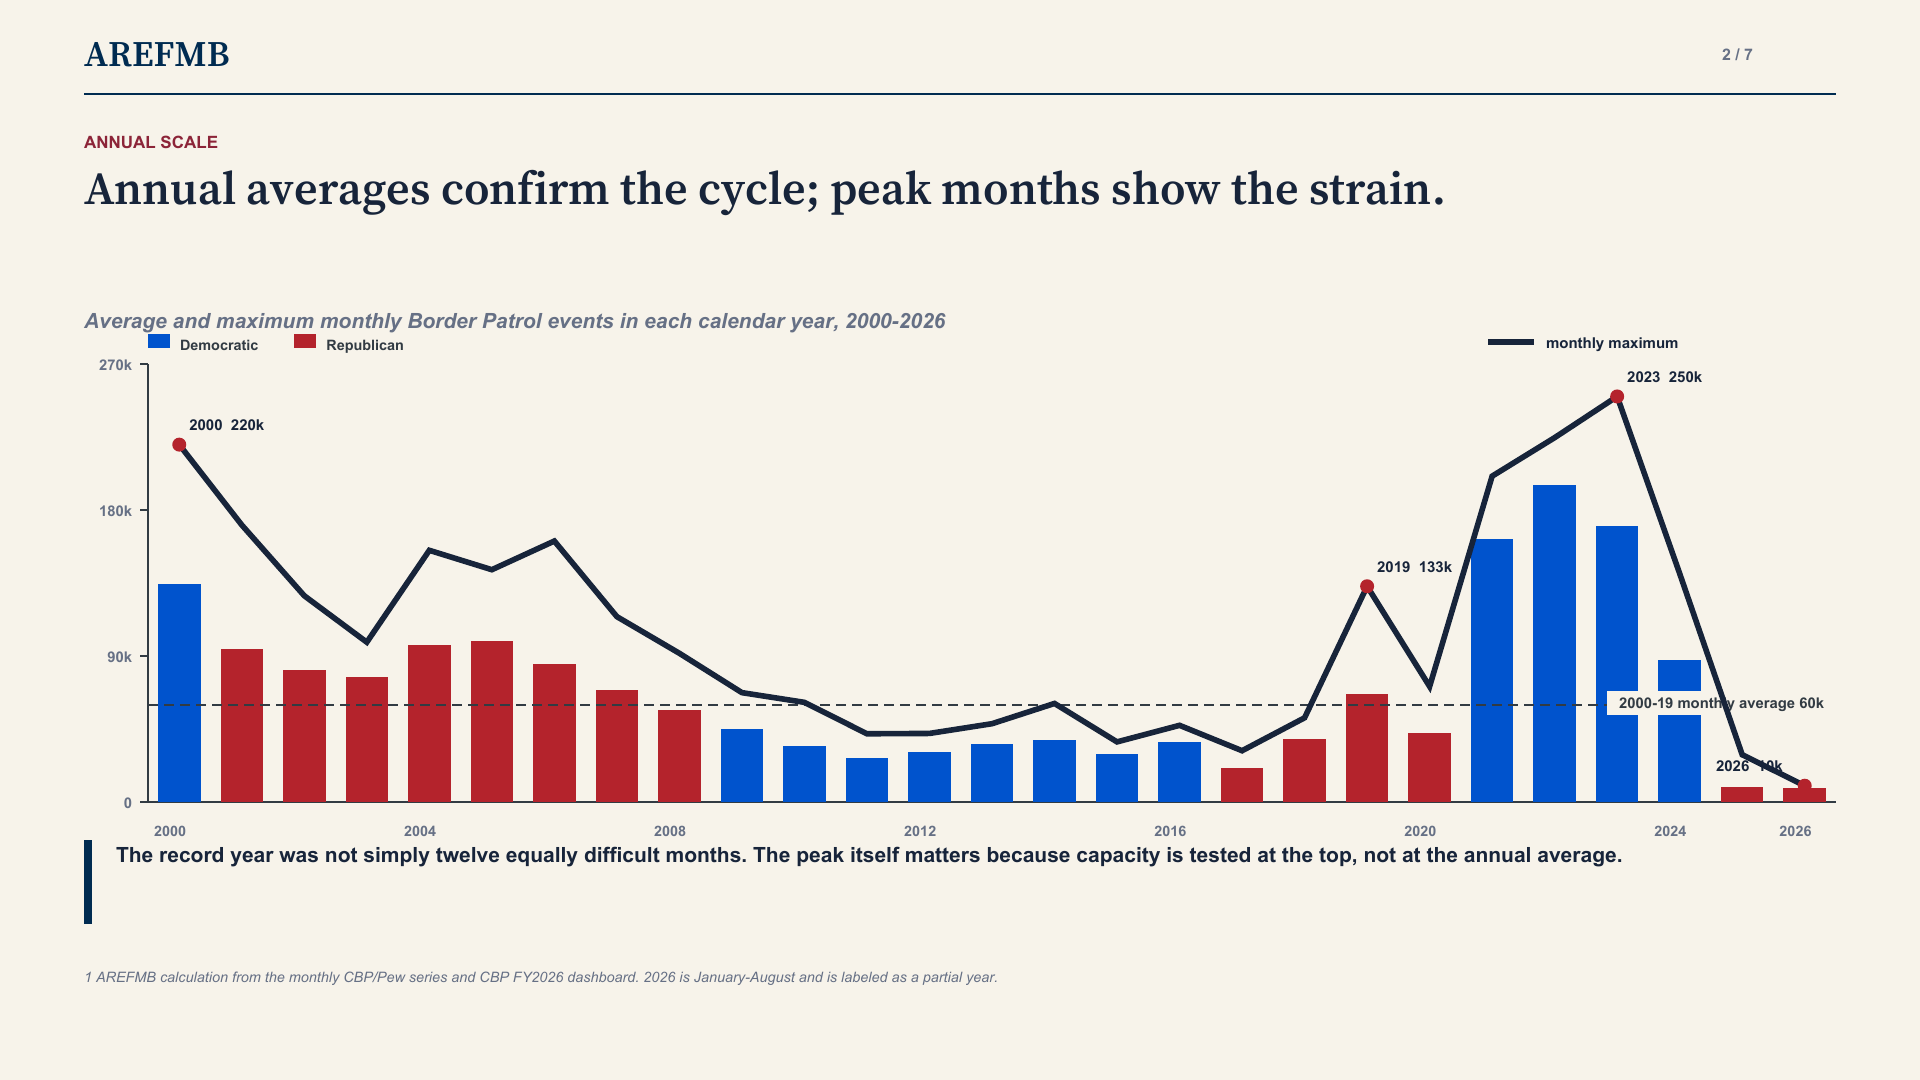
Calendar 2026 covers January through August. January transition months are shown separately where administrations changed.
What the record permits: Democrats cannot minimize the scale of the Biden-era surge. Republicans cannot describe low border activity as an exclusively Republican outcome—or ignore the 2019 increase under Trump.
02 · The reversal
The latest decline has two stages
The recent reversal began before the 2025 change in administration. Southwest Border Patrol events fell from 249,740 in December 2023 to 47,320 in December 2024—an 81% decline while Biden remained president. The fall accelerated after the administration’s June 2024 asylum restriction and increased Mexican enforcement, although timing alone cannot isolate either policy’s effect.5
Trump then produced a second operational break. February 2025, the first full calendar month of his second term, recorded 8,349 events—82% below December 2024 and 94% below February 2024. By August 2026, the monthly figure was still only 8,870.2
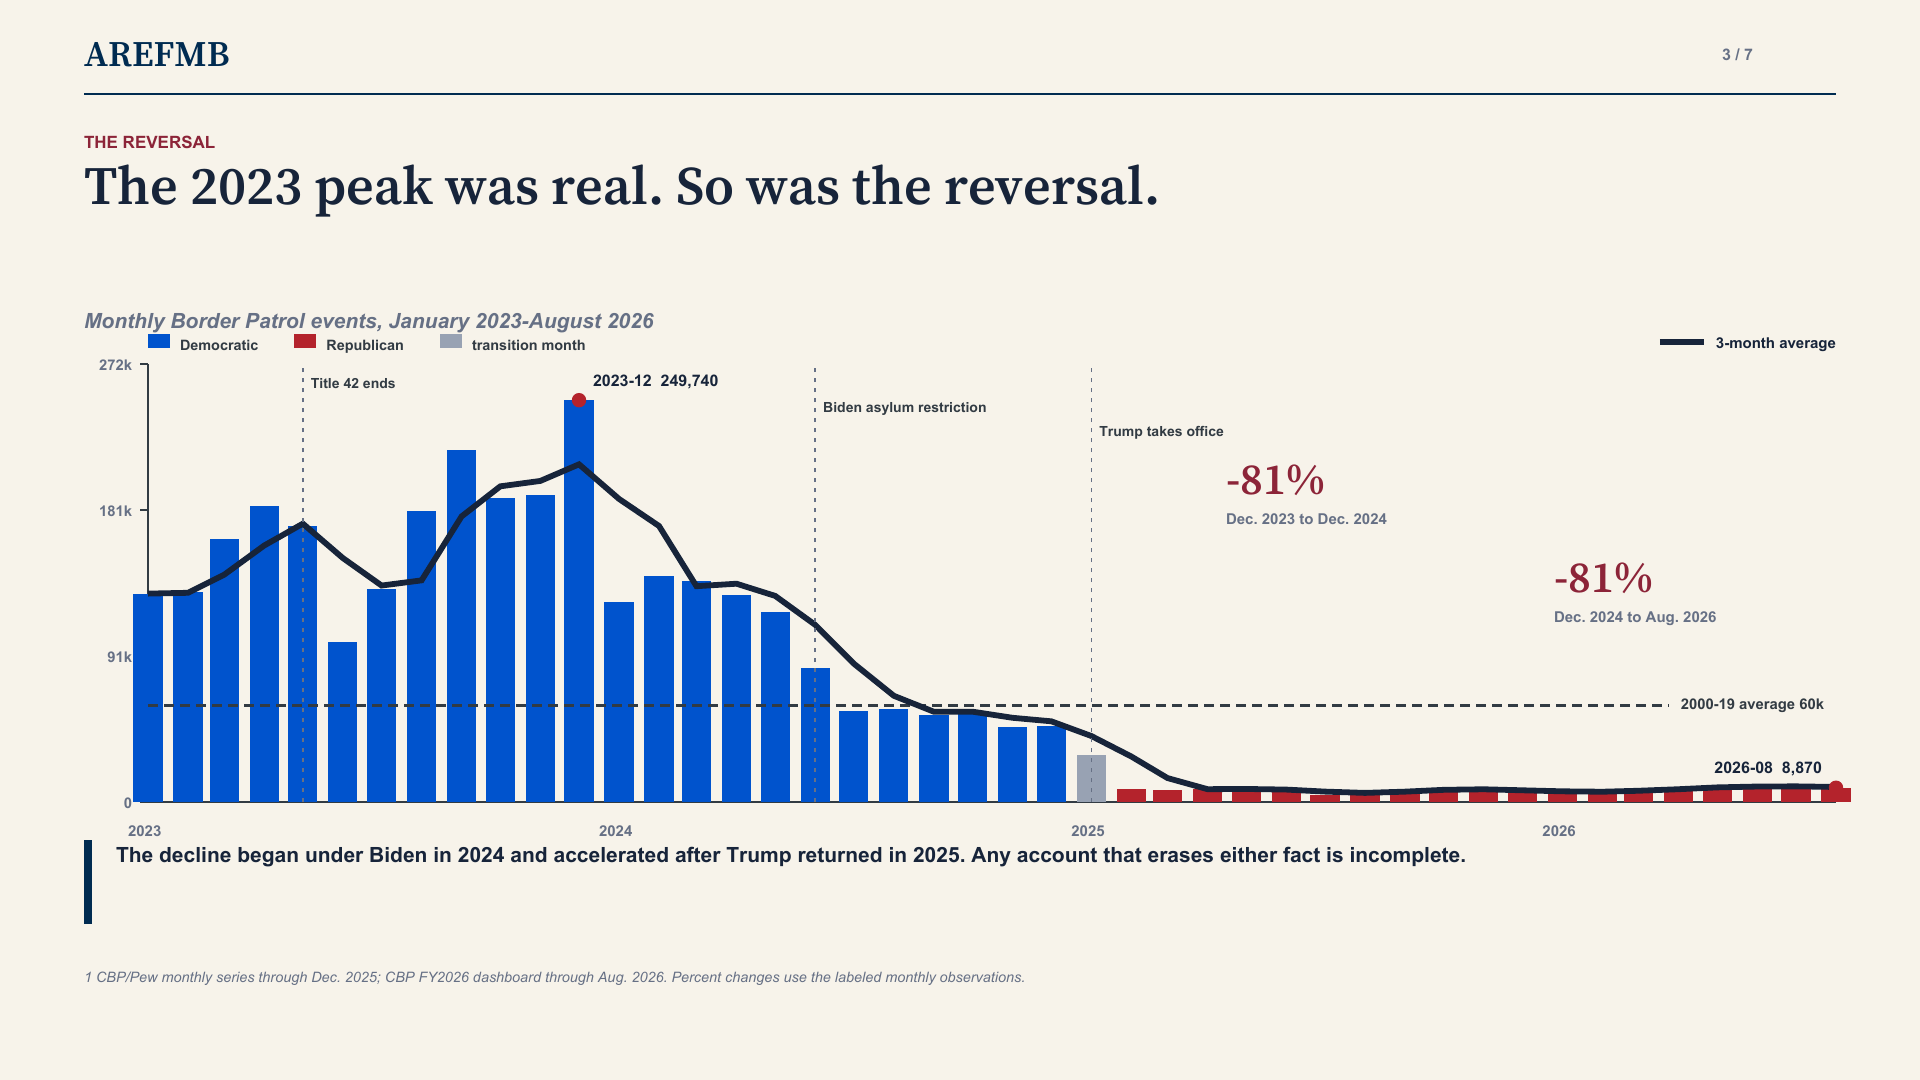
The chronology supports a two-stage account: a large late-Biden decline followed by a further and durable Trump-era reduction.
The fair conclusion is not that both administrations deserve equal credit. Trump pushed an already declining series to levels Biden did not reach and sustained them. But it is equally inaccurate to date the entire reversal to inauguration day. By then, the December 2023 peak had already fallen by four-fifths.
03 · What the number measures
Title 42 changed policy—and the headline statistic
Before March 2020, the long-run Border Patrol series primarily counted apprehensions. During Title 42, it also counted public-health expulsions. The policy enabled rapid expulsion and was associated with more repeat attempts, so one person could generate multiple events. Splicing the periods together without a visible break overstates the comparability of the line.
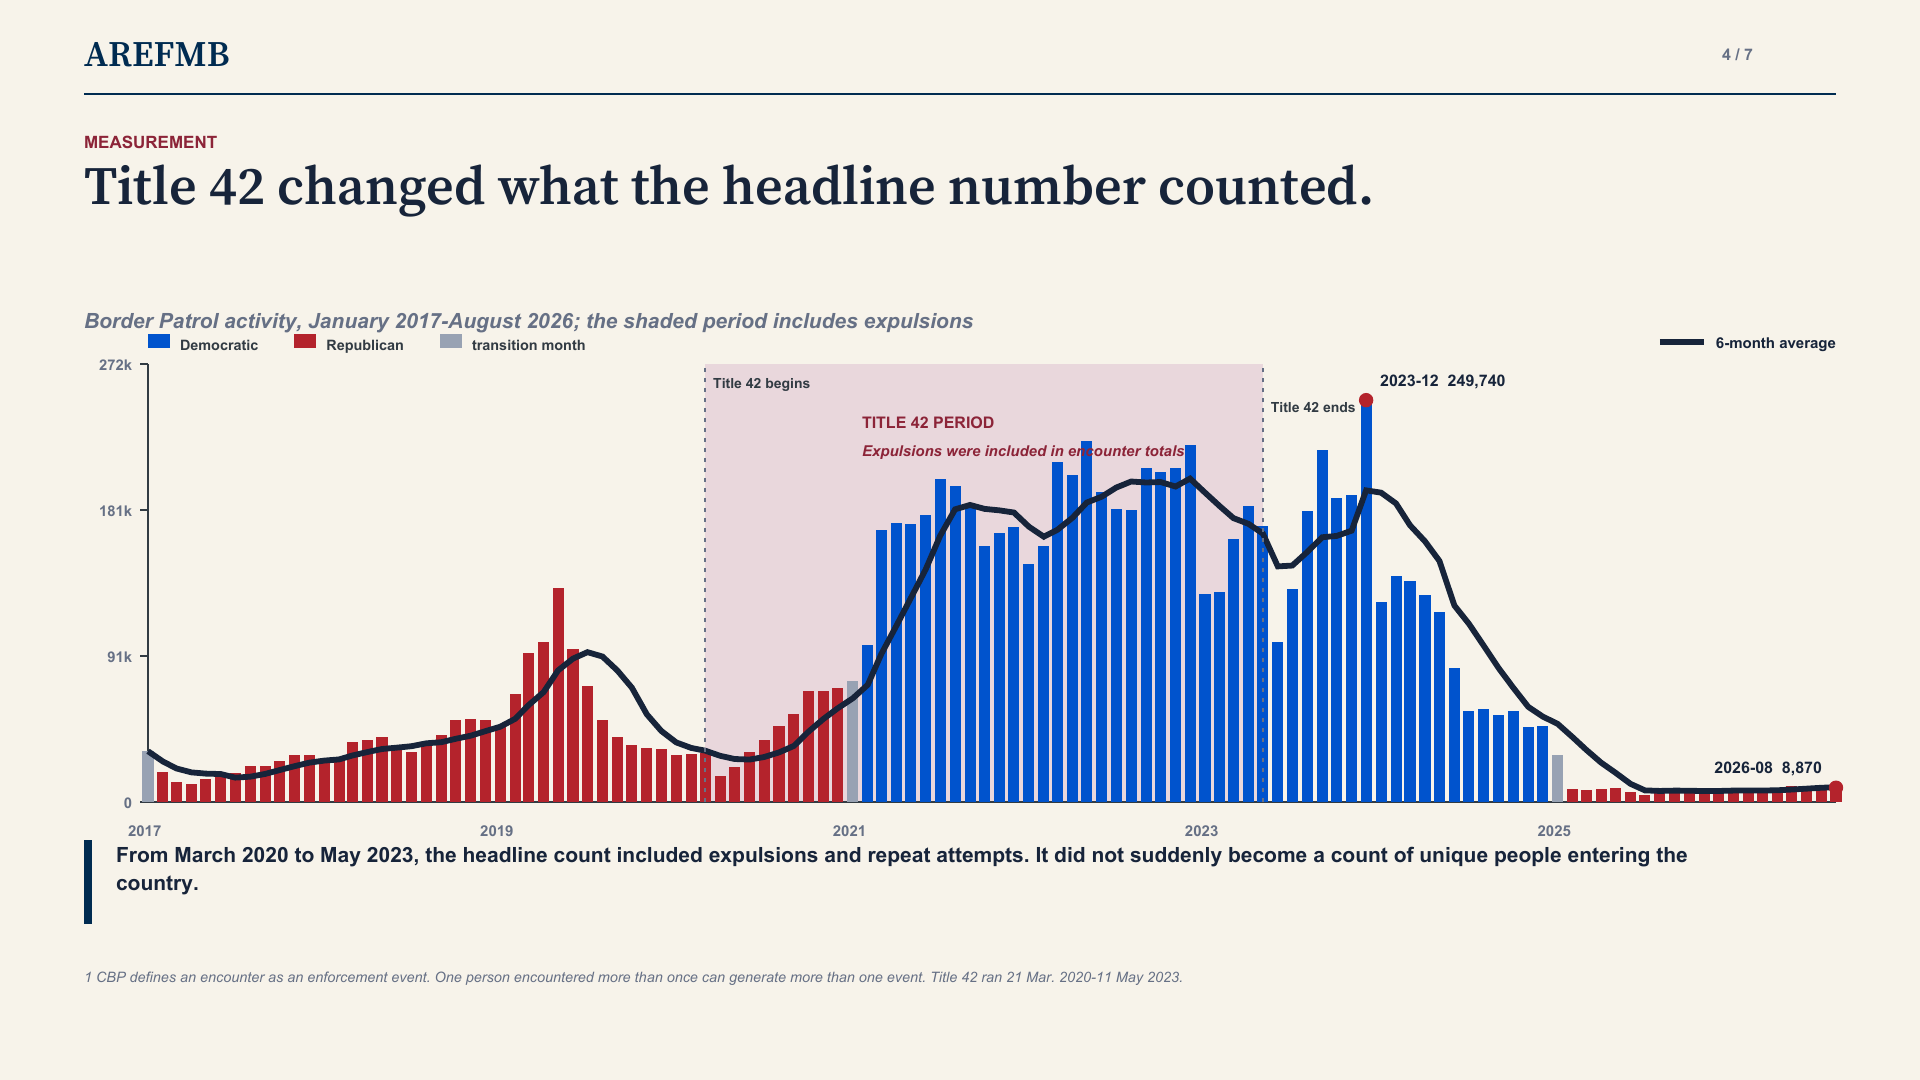
An encounter is an enforcement event. It is not a unique person, a successful illegal entry, or a change in the unauthorized resident population.
Seasonality is real: spring months have often been higher than winter months. But the 2021–2024 period was elevated in nearly every month of the calendar. Seasonal comparisons therefore refine the story; they do not explain away its scale.
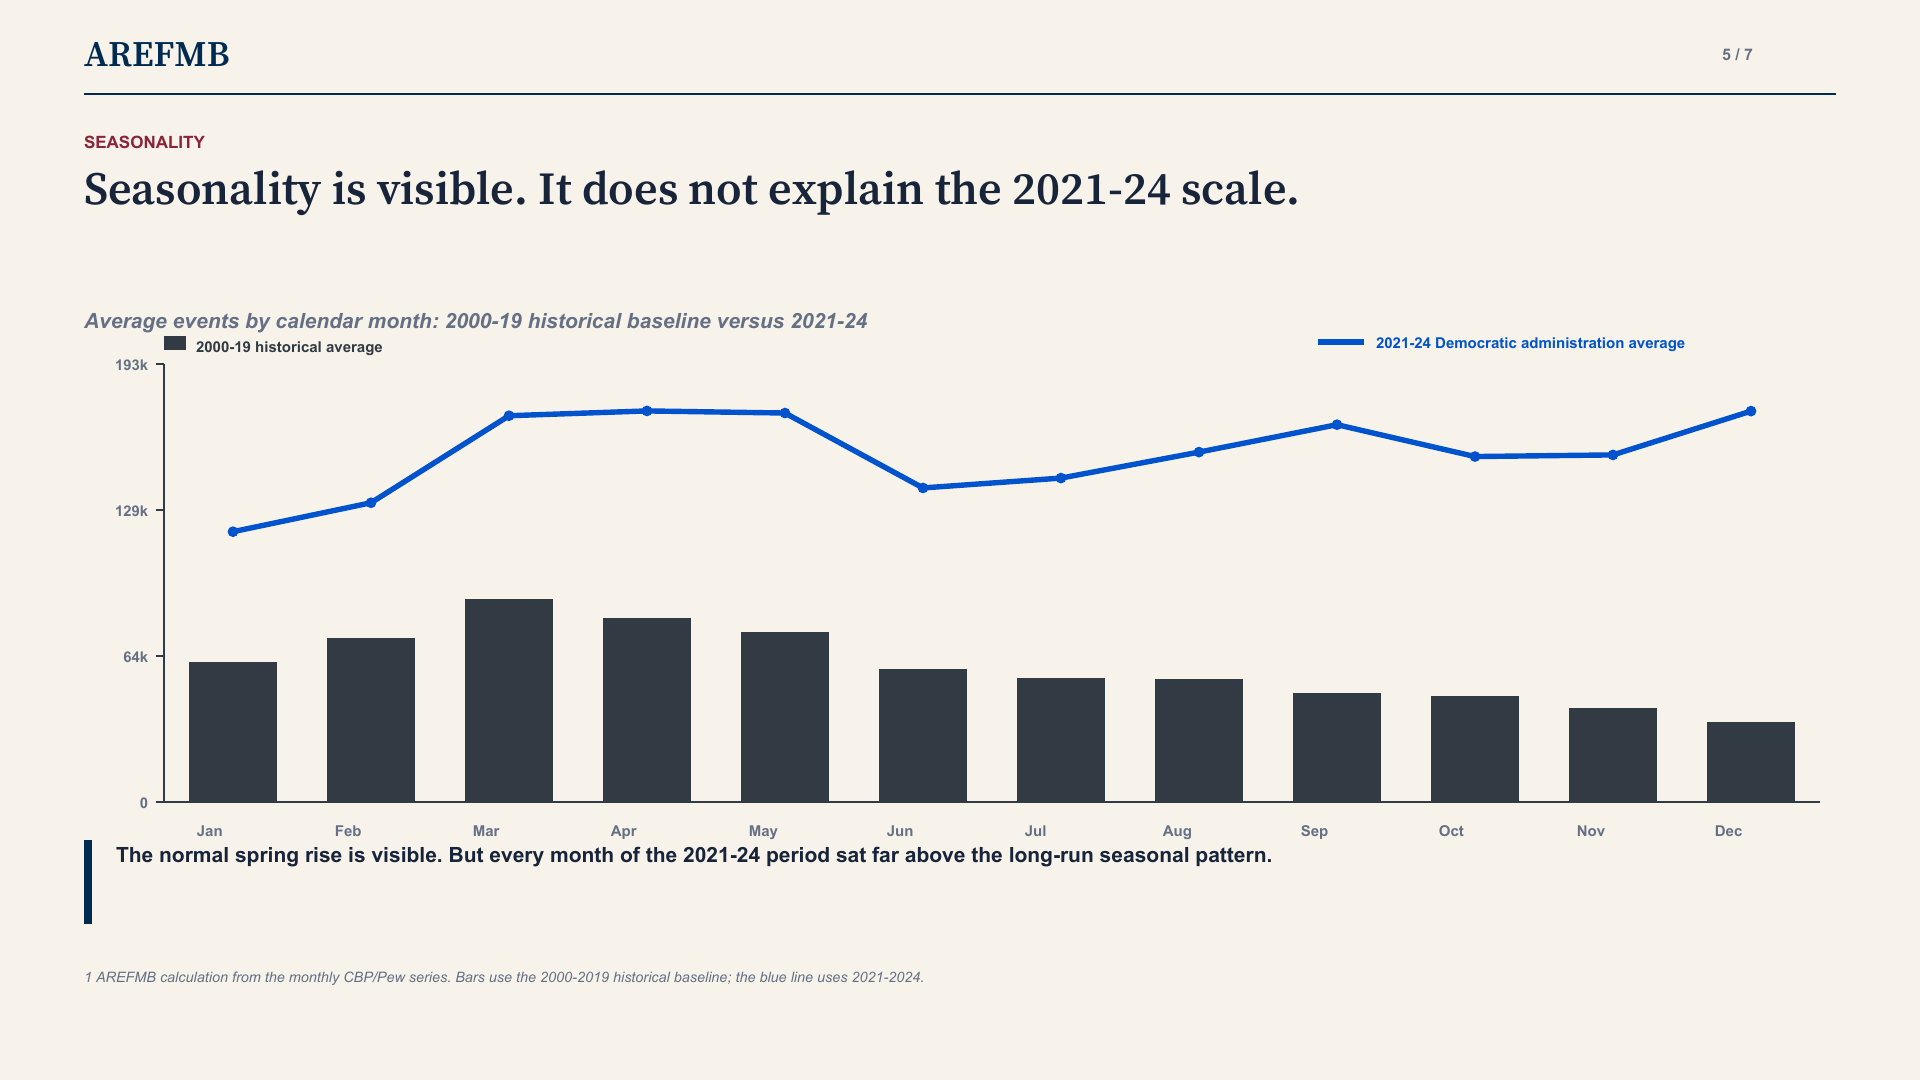
The comparison uses monthly averages rather than a single peak or trough.
04 · Policy and operations
Executive action can move the chart quickly
The federal government created the Department of Homeland Security in 2002 and enacted the Secure Fence Act in 2006. Later administrations used more reversible executive tools: Remain in Mexico, Title 42, parole pathways, CBP One appointments and successive asylum restrictions.
The three-month windows around selected changes are descriptive, not causal estimates. Migration is also affected by enforcement in Mexico, economic conditions, smuggling networks, litigation and crises abroad. Still, the comparison shows why presidential policy matters operationally: the sharpest immediate break in this set followed the 2025 change in administration.
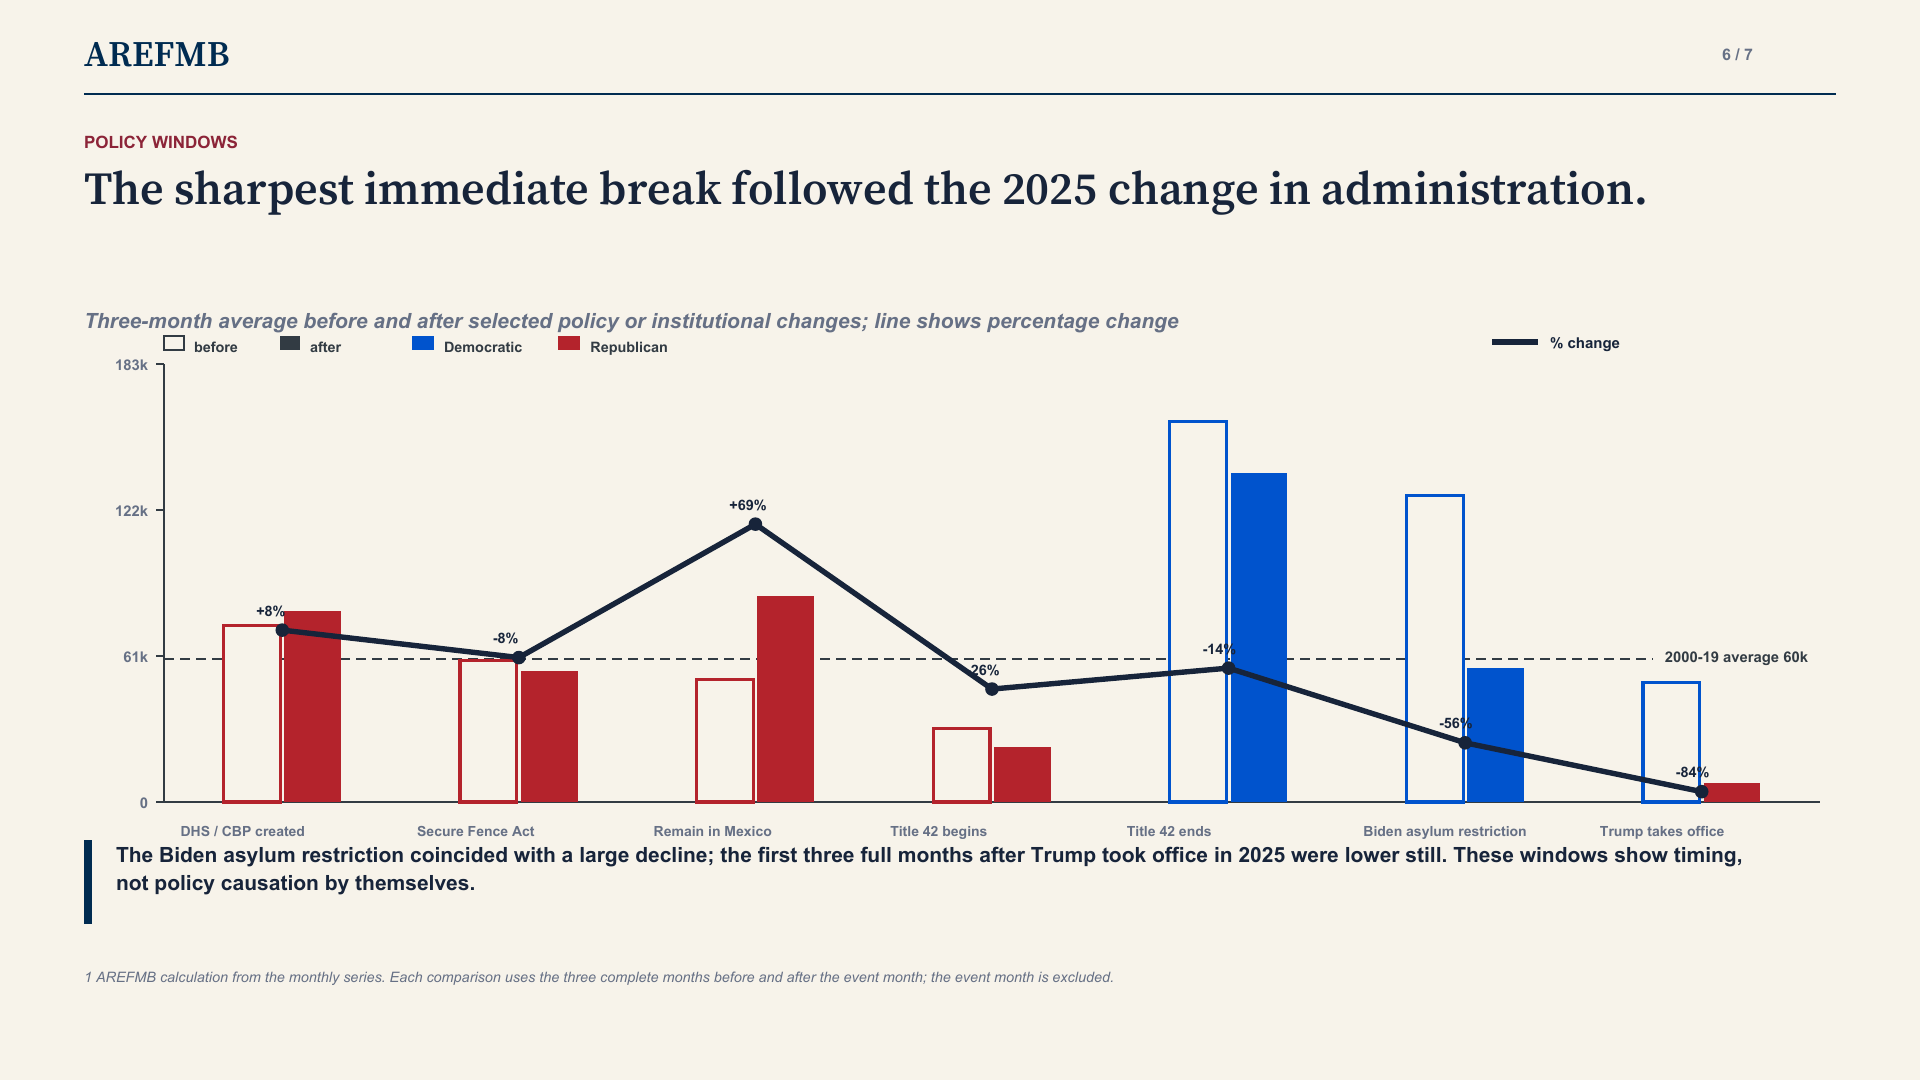
The event month is excluded. A before-and-after comparison identifies timing; it does not prove that one policy caused the entire change.
Congress built much of the machinery but has not created a durable settlement. A bipartisan Senate immigration bill passed in 2013 but did not become law. A later bipartisan border package failed in 2024. The result is a system whose central operating rules can change with the president, the courts or an emergency authority.
05 · Enforcement outcomes
Removals tell a different story from encounters
Formal removals are compulsory, confirmed departures under an order of removal. They are not the same as encounters, returns or Title 42 expulsions. The DHS monthly series used here covers October 2013 through November 2024 and includes removals completed by ICE/ERO and CBP.
Formal removals averaged about 28,100 a month from 2014 through 2019. During the Title 42 period, the average fell to roughly 9,100 because expulsions were recorded separately. From June 2023 through November 2024, formal removals recovered to about 26,500 a month. November 2024 recorded 25,800.
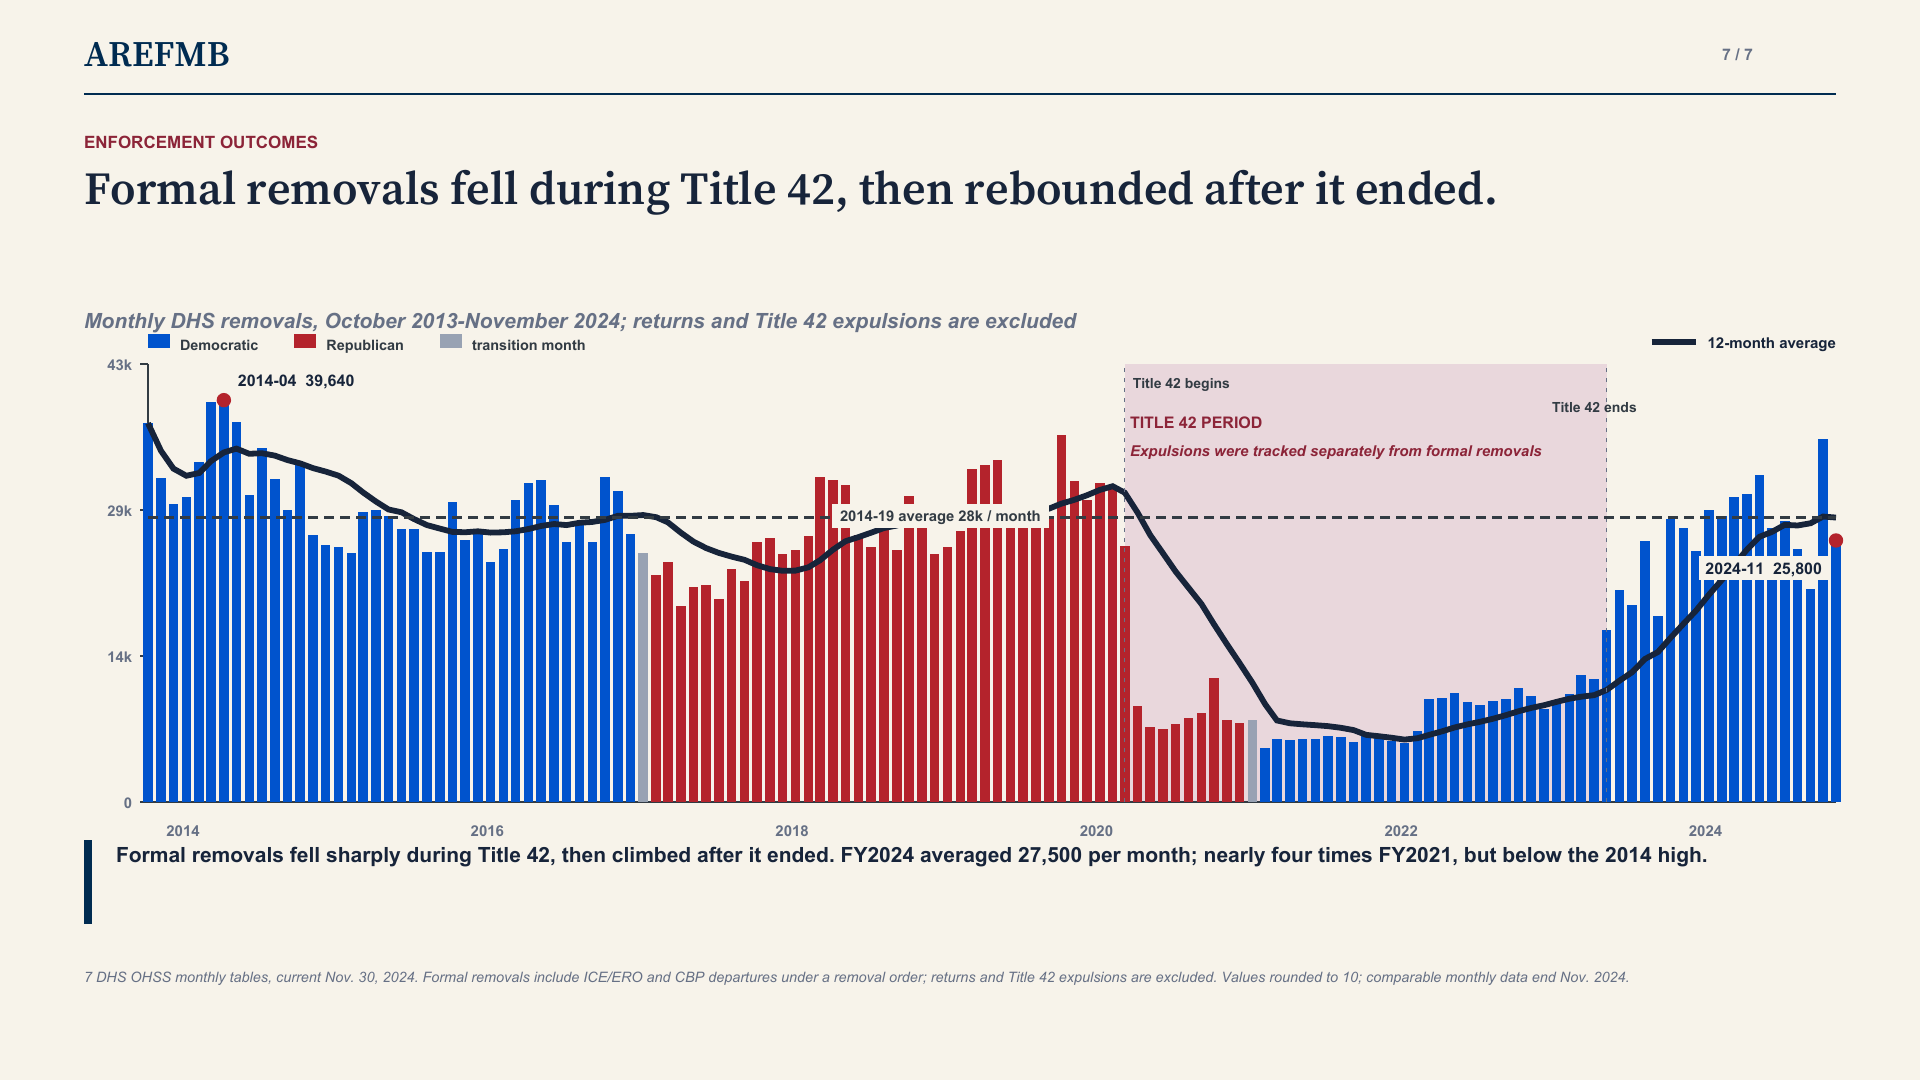
This series excludes returns and Title 42 expulsions. Comparable monthly DHS removal data after November 2024 are not included in the approved package.
This distinction matters politically. A high encounter total does not tell the reader how many people were released, returned, removed, detained or later prevailed in an immigration case. A low total does not prove that no one crossed undetected. Operational performance should be evaluated across several measures, not converted into one partisan slogan.
06 · What voters should know
Three conclusions survive the partisan argument
First, the surge and the reversal both cross party lines.
The Biden administration presided over the largest recorded surge in this series. It also presided over most of the initial decline from the December 2023 peak. Trump then drove the figure much lower and held it there.
Second, the current Republican administration has a strong operating result.
The scale and persistence of the 2025–2026 lows are visible in the monthly record. That is a meaningful result. It does not require rewriting when the decline began.
Third, the result is not yet a durable immigration system.
Presidents can change the monthly chart quickly because Congress has left so much policy to executive action. The next president can reverse those rules quickly as well.
Candidates should therefore be asked for more than a promise to be “tough” or “humane.” Which authorities would they preserve? Who would be detained, released, returned or removed? How quickly? What would change in the asylum process? What safeguards would govern enforcement? And which monthly measures would allow the public to judge whether the policy worked?
The country has enough history to ask those questions precisely. It should expect answers that can be measured the same way.
Sources
- Pew Research Center, monthly U.S. Border Patrol table sourced to U.S. Customs and Border Protection: pewresearch.org.
- U.S. Customs and Border Protection, Southwest Border enforcement dashboard, August FY2026: publicstats.cbp.gov.
- U.S. Department of Homeland Security, Office of Homeland Security Statistics, Immigration Enforcement and Legal Processes Monthly Tables, data current through November 30, 2024.
- Homeland Security Act of 2002, Pub. L. 107-296: govinfo.gov; Secure Fence Act of 2006, Pub. L. 109-367: govinfo.gov.
- U.S. Customs and Border Protection, “CBP Releases June 2024 Monthly Update”: cbp.gov.
- U.S. Senate, February 7, 2024 cloture vote on the border and national-security package: senate.gov.