Oil shocks are often described as if they are interchangeable: war, fewer barrels, higher prices. They are not.
I wanted to compare the most acute oil-price moves since 1970 because 2026 feels familiar for one reason. Iran is again at the center. But it is operating through a different mechanism. In 1979, revolution removed barrels from the market and destabilized a country that had been a central supplier. In 2026, military action and control of the Strait of Hormuz turned the transit route itself into the instrument of pressure.
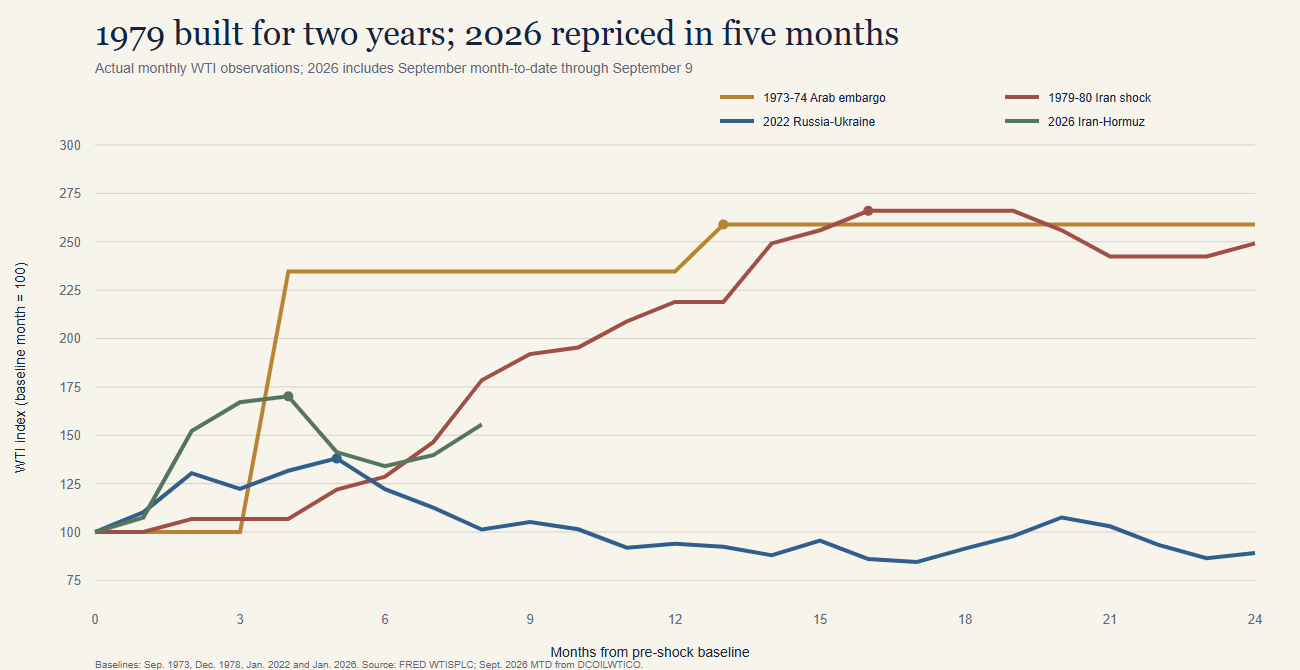
That distinction matters. It helps explain why the 1979 shock built for well over a year, while the 2026 market repriced much faster. It also explains why an announced increase in production is not the same thing as deliverable supply when tankers cannot move normally through the Gulf.
What the comparison shows
| Episode | Baseline | Peak | Increase | Time to peak |
|---|---|---|---|---|
| 1973–74 Arab embargo | Sep. 1973 $4.31 | Oct. 1974 $11.16 | 158.9% | 13 months |
| 1979–80 Iran shock | Dec. 1978 $14.85 | Apr. 1980 $39.50 | 166.0% | 16 months |
| 2022 Russia–Ukraine | Jan. 2022 $83.22 | Jun. 2022 $114.84 | 38.0% | 5 months |
| 2026 Iran–Hormuz | Jan. 2026 $60.04 | May 2026 $102.13 | 70.1% | 4 months |
Using the FRED monthly WTI series, the 1979–80 episode produced the largest percentage increase in this comparison: WTI rose from $14.85 a barrel in December 1978 to $39.50 in April 1980, an increase of 166%. The 1973–74 move was nearly as large, rising 159% from September 1973 to October 1974.
The 2026 increase has been smaller but much faster. Monthly WTI rose from $60.04 in January to $102.13 in May, a 70% increase in four elapsed months. The first six daily observations in September averaged $93.39 through September 9. The price remained elevated even after falling from the spring peak.
The 2022 Russia–Ukraine shock was acute but, on this baseline, less extreme: WTI rose 38% from January to its June peak. That does not make 2022 unimportant. It means the market entered the invasion after a separate 2021 demand-recovery squeeze had already lifted prices. I treat 2021 as context, not as the same geopolitical event.
1973: collective producer power
The 1973–74 embargo was a coordinated act by Arab oil producers after the United States resupplied Israel during the Yom Kippur War. The U.S. State Department’s historical record describes both an embargo against the United States and production cuts. The price of oil doubled and then quadrupled during the crisis.
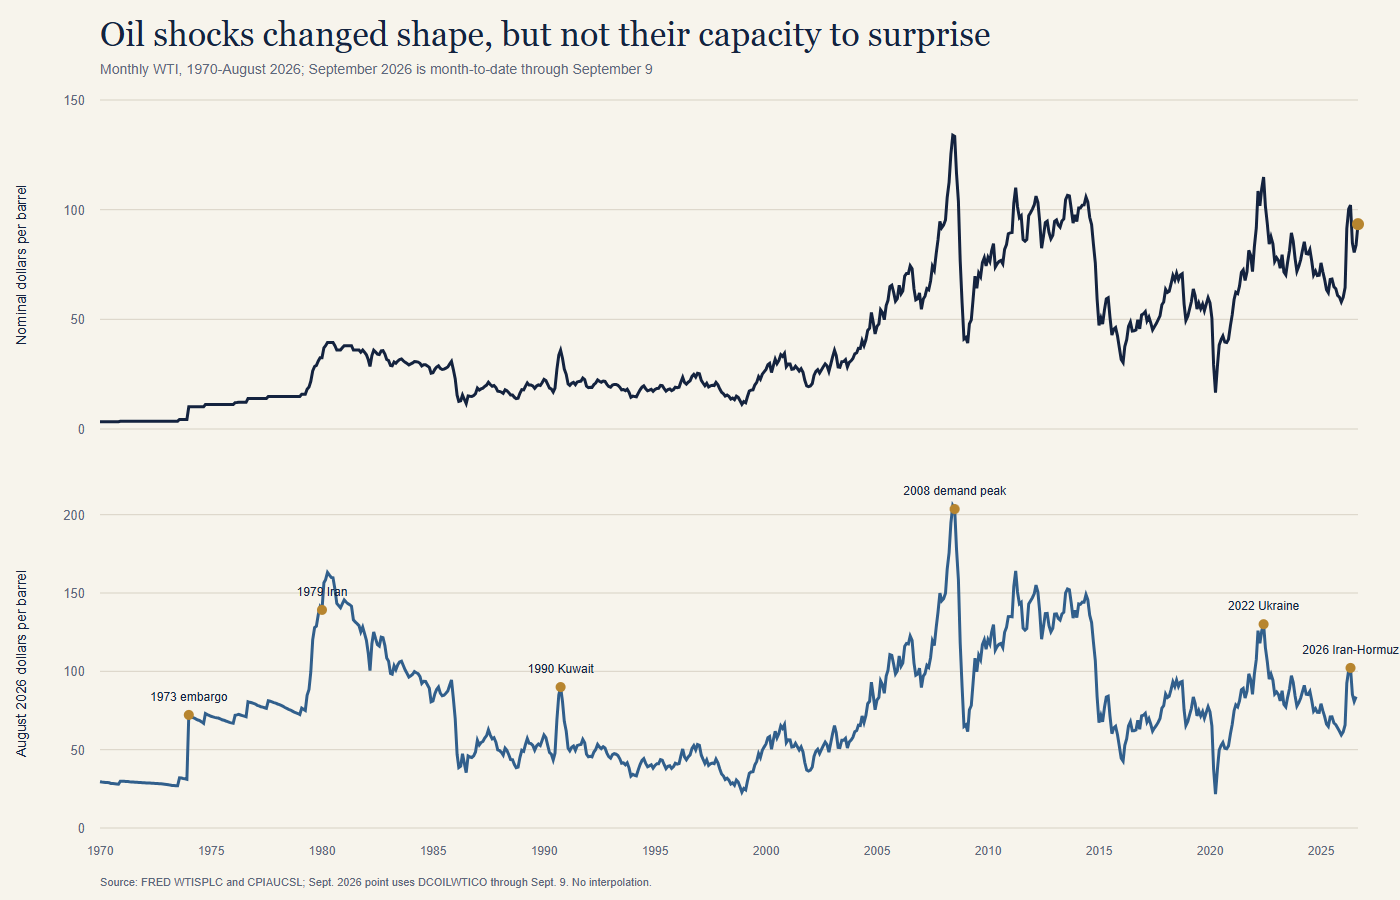
That episode established the familiar model of oil as collective leverage: producers could restrict supply through a political alliance and impose economic costs on consuming countries. The price path in the chart looks unusually step-like because the pre-1982 portion of the FRED splice uses posted benchmark prices rather than a modern continuously traded WTI spot market. The steps are a feature of the historical series, not invented observations.
1979: a state crisis became a global supply shock
The second oil shock began with the Iranian Revolution. In January 1979, the State Department estimated that Iran’s loss of exports reached 5.0 to 5.5 million barrels a day. Other producers—especially Saudi Arabia—replaced much of it, but not all. The net shortfall was still estimated at 1.5 to 2.0 million barrels a day.
The immediate cause was therefore physical and political: the collapse of production and exports during a revolution. The market then had to absorb a succession of strategic risks. The Soviet Union invaded Afghanistan in late December 1979, placing a military crisis next to the oil-producing Gulf and helping produce the Carter Doctrine. Iraq invaded Iran on September 22, 1980, damaging production and adding another supply disruption.
The sequence is important. Afghanistan did not cause the original Iranian production loss. The Iran–Iraq War began after much of the price increase had already occurred. Both events widened the geopolitical frame and prolonged the sense that the region’s supply system was unstable.
2022: invasion met an already tight market
Russia’s invasion of Ukraine pushed Brent above $100 and WTI above $110 in early March 2022. Sanctions, uncertainty over Russian exports, low inventories and restrained production all mattered. But the starting point was different from 1979. Oil had already risen during the post-pandemic recovery as demand returned faster than supply.
The acute geopolitical spike still belongs in the comparison because the invasion changed the distribution of Russian barrels, shipping routes and the risk premium. It does not belong in the same causal category as the entire 2021–22 increase. Separating those two phases avoids assigning every dollar of the move to the war.
2026: the chokepoint became the weapon
The defining feature of 2026 is not a coordinated producer embargo. It is direct military disruption around the Strait of Hormuz. EIA describes military action beginning February 28 and a de facto closure of the strait. Brent began the year near $61 and ended the first quarter at $118, the largest inflation-adjusted quarterly increase in EIA’s comparable history since 1988.
This is why the usual supply response was less effective. OPEC+ could discuss or announce additional production, but extra barrels had limited value if the route through which much of the region’s oil and liquefied natural gas normally moved was constrained. Later reopening arrangements reduced prices, but renewed attacks and restrictions kept the market vulnerable.
Iran was still part of the regional producer system. The point is narrower: the mechanism of leverage was not coordinated OPEC withholding. It was a state acting through military force, tanker risk and control of a transit chokepoint. That is more unilateral and overtly military than the 1973 model.
Why 1979 is the right comparison—but not a repeat
The parallel is Iran, supply fear and a market forced to price regional escalation. The differences are the condition of the state and the route through which pressure reached the market.
In 1979, domestic revolution disabled an important exporter. The price climbed as lost production, political transition and later wars accumulated. In 2026, Iran’s state capacity was the source of pressure. Military action and transit control caused a much faster repricing. One shock came from a supplier falling apart. The other came from a supplier using geography and force.
The chart also shows why the analogy should not be overstated. The 1979 move was larger and more persistent on the selected monthly measure. The 2026 episode remains unfinished. Its eventual scale and duration will depend less on a headline production target than on whether shipping can move safely and consistently through Hormuz.
The useful background cases
Two other episodes clarify the comparison. Iraq’s 1990 invasion of Kuwait created a sudden supply interruption and rapid run-up, followed by an equally sharp reversal after the coalition response. The 2008 peak was larger in nominal dollars, but its central engine was global demand, constrained capacity and financial conditions rather than a single foreign-policy shock. The subsequent collapse during the financial crisis confirms how different that cycle was.
Those cases matter because a large price move is not automatically an oil embargo and not automatically a war premium. The cause determines what can reverse it.
What matters now
The first question is physical transit: are tankers moving, at what volume, with what insurance and delay? The second is duration: can temporary routes or agreements become reliable enough to remove the risk premium? The third is substitution: can production outside the Gulf reach refiners quickly enough to matter?
The 2026 market has already demonstrated that spare capacity on paper is not identical to accessible supply. If the route remains impaired, the barrel will keep carrying a geopolitical premium. If transit normalizes, the 1990 pattern—a sharp rise followed by a fast reversal—may become more relevant than 1979.
History does not provide a price target. It does provide a better question. Do not ask only how many barrels producers say they can supply. Ask whether those barrels can move.
Methodology
Price data are the FRED monthly WTI spot-price splice (WTISPLC). FRED identifies the series as a splice: January 1946 through July 2013 uses the Oil Price: West Texas Intermediate series, and observations before 1982 equal posted prices. The modern WTI futures market did not yet exist for the 1970s episodes. No values were estimated, interpolated or filled. September 2026 is a simple average of six available daily DCOILWTICO observations through September 9; blank dates and the September 7 holiday are excluded. Inflation-adjusted values use CPIAUCSL and are expressed in August 2026 dollars. Episode baselines were selected before the acute geopolitical move and are disclosed in the table. Different baselines would change the percentages.
The Apple Podcasts episodes supplied for research were used only as topic leads. No podcast transcript was quoted or treated as source evidence. Charts and analysis were built by AREFMB from public FRED data.
Sources
- FRED — monthly WTI spot-price splice (WTISPLC)
- FRED — daily WTI spot price (DCOILWTICO)
- EIA — crude-oil price shocks and political disruptions
- U.S. State Department — the 1973–74 oil embargo
- U.S. State Department — the January 1979 Iranian oil shortfall
- U.S. State Department — the Soviet invasion of Afghanistan
- U.S. State Department — Iran–Iraq war and oil exposure, September 24, 1980
- EIA — oil markets after Russia’s 2022 invasion of Ukraine
- EIA — 2022 WTI review
- EIA — first-quarter 2026 Strait of Hormuz disruption
- EIA — July 2026 oil-market update
- EIA — September 2026 Short-Term Energy Outlook
- Associated Press — OPEC+ output plans amid blocked Hormuz traffic
By Aref M. Bajwa